To calculate inflation in Excel, use the formula: `((New Value – Old Value) / Old Value) * 100`. This gives the inflation rate as a percentage.
Inflation affects the purchasing power of money, making it crucial to track. Accurate calculation of inflation helps businesses and individuals plan their finances better. Excel offers a straightforward way to calculate inflation rates, which can be useful for financial analysis.
By understanding the basic formula, you can easily keep tabs on inflation’s impact. Excel’s built-in functions facilitate quick and accurate calculations, ensuring you stay on top of economic changes. Mastering this formula can significantly enhance your financial planning and decision-making processes. Keep your financial data up-to-date by regularly calculating inflation in Excel.

Credit: m.youtube.com
Introduction To Inflation
Inflation is a crucial economic concept. It affects everyone in society. Understanding inflation helps in financial planning. This blog post will explain the basics of inflation.
What Is Inflation?
Inflation refers to the rise in prices of goods and services. It reduces the purchasing power of money. Imagine you could buy a toy for $1 last year. Now, the same toy costs $1.10. That is inflation in action. Economists use inflation rates to measure this change.
Importance Of Inflation Calculations
Knowing how to calculate inflation is very important. It helps you understand the value of your money. You can plan your savings and investments better.
- Budgeting: Helps in planning household expenses.
- Investments: Guides your investment decisions.
- Salaries: Ensures fair salary adjustments.
Let’s look at a simple example. Assume you have $1000 today. The inflation rate is 5% per year. Next year, your $1000 will be worth less. You will need more money to buy the same items.
| Year | Value of $1000 | Inflation Rate |
|---|---|---|
| Year 0 | $1000 | 0% |
| Year 1 | $950 | 5% |
| Year 2 | $902.50 | 5% |
This table shows how inflation impacts money over time. Learning to calculate inflation helps you stay ahead.
Basic Excel Functions
Understanding basic Excel functions is crucial for financial analysis. Excel offers powerful tools for calculating and analyzing data, including inflation. Knowing these functions helps you make accurate financial predictions.
Excel Basics
Excel is a versatile tool for data management. You can use it for everything from simple calculations to complex financial models. Here are some basic functions you should know:
- =SUM(): Adds up a range of numbers.
- =AVERAGE(): Calculates the mean of a range.
- =COUNT(): Counts the number of cells with numbers.
- =MAX(): Finds the highest number in a range.
- =MIN(): Finds the lowest number in a range.
Key Functions For Inflation
To calculate inflation in Excel, you can use several key functions. These functions help you analyze changes in price levels over time.
- =RATE(): Calculates the interest rate per period. Useful for finding the annual inflation rate.
- =PV(): Determines the present value of an investment. This helps in understanding the value of money today.
- =FV(): Calculates the future value of an investment. Useful for projecting future price levels.
- =NPV(): Computes the net present value. This helps in comparing different investment options.
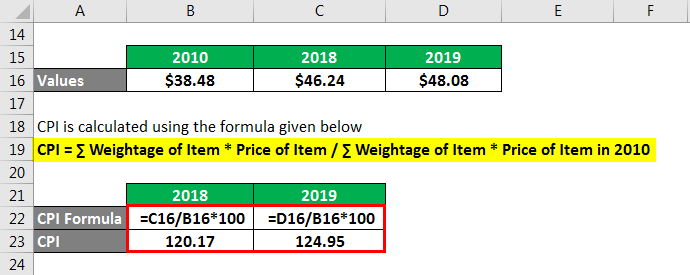
- =CPI(): While not a built-in function, you can use custom formulas to calculate the Consumer Price Index.
For instance, to calculate the inflation rate between two periods:
=((CPI_End - CPI_Start) / CPI_Start) * 100By mastering these functions, you can effectively analyze inflation and make better financial decisions.
Setting Up Your Data
Before calculating inflation in Excel, you need to set up your data correctly. This involves collecting the necessary data and organizing it efficiently. Follow these steps to ensure accuracy and ease of use.
Data Collection
First, gather all the required data. You will need the following:
- Price data for different time periods
- Date information for each price data point
Ensure that your data is accurate and up-to-date. This is crucial for precise calculations.
Organizing Data In Excel
Next, organize your data in Excel. Create a table with the following columns:
| Date | Price |
|---|---|
| 01/01/2020 | $100 |
| 01/01/2021 | $110 |
Make sure each row corresponds to a different date and price point. This structure helps in easy referencing and calculations.
Use the DATE column for time periods and the PRICE column for corresponding prices. This setup allows for clear and concise data management.
Remember to format your cells correctly. Set the date format for the DATE column and currency format for the PRICE column. This ensures consistency and accuracy in your calculations.

Credit: superuser.com
Inflation Formula In Excel
Calculating inflation is essential for understanding economic trends. Excel offers powerful tools for this. You can easily compute inflation using basic formulas. This section covers two main methods: Simple Inflation Calculation and Using the CPI Index.
Simple Inflation Calculation
To calculate inflation simply, you need two numbers: the initial value and the final value. Use the following formula:
Inflation Rate = ((Final Value - Initial Value) / Initial Value) * 100
Let’s say you have an initial value of $100 and a final value of $120. The formula in Excel would look like this:
= ((120 - 100) / 100) * 100
This will give you an inflation rate of 20%.
Using The Cpi Index
The Consumer Price Index (CPI) is another method to calculate inflation. You need the CPI for two periods. Use the following formula:
Inflation Rate = ((CPI at End - CPI at Start) / CPI at Start) * 100
Suppose the CPI at the start is 200, and at the end, it is 250. The formula in Excel would be:
= ((250 - 200) / 200) * 100
This will give an inflation rate of 25%.
Here’s a simple table to illustrate these calculations:
| Initial Value | Final Value | Inflation Rate |
|---|---|---|
| $100 | $120 | 20% |
| CPI at Start | CPI at End | Inflation Rate |
| 200 | 250 | 25% |
Use these formulas in Excel to track and analyze inflation efficiently. These methods are simple but powerful. They provide valuable insights into economic conditions.
Advanced Inflation Calculations
Understanding advanced inflation calculations can help you make better financial decisions. In Excel, you can calculate compound inflation rates and forecast future inflation. Let’s explore these advanced techniques.
Compound Inflation Rates
Compound inflation rates take into account the cumulative effect of inflation over multiple periods. It’s crucial for long-term financial planning. Here’s how to calculate it in Excel:
- Enter the inflation rate for each year in a column.
- Use the formula:
=PRODUCT(1 + A1:A5) - 1to find the compound rate over five years.
For example, if the annual rates are 2%, 3%, and 4%:
| Year | Inflation Rate |
|---|---|
| Year 1 | 2% |
| Year 2 | 3% |
| Year 3 | 4% |
The compound inflation rate is calculated as:
=PRODUCT(1 + {0.02, 0.03, 0.04}) - 1
This gives a total compound rate of approximately 9.27%.
Forecasting Future Inflation
Forecasting future inflation helps you plan ahead. You can use Excel to make these predictions. Follow these steps:
- Gather historical inflation data.
- Use Excel’s TREND function to predict future values.
For example, if the past rates are in cells A1 to A5:
=TREND(A1:A5, {1,2,3,4,5}, {6,7,8})
This formula forecasts the inflation rates for the next three years. Understanding these predictions helps in budgeting and investment planning.
By mastering these advanced inflation calculations, you can stay ahead financially. Use Excel to make these complex calculations simple and effective.
Visualization Techniques
Visualization techniques help to understand the Excel Inflation Formula easily. They turn numbers into visual stories, making data clearer and more engaging.
Creating Charts
Charts are great for visualizing inflation data. They show how values change over time.
To create a chart in Excel:
- Enter your data in cells.
- Select the data range.
- Go to the Insert tab.
- Choose a chart type like Line or Bar.
Charts can highlight trends and patterns. They make it easier to compare different time periods.
Using Graphs For Trends
Graphs are another effective tool. They can show trends and predict future inflation rates.
To create a graph:
- Select your data.
- Click on Insert.
- Choose Scatter or Line Graph.
Graphs help in identifying peaks and troughs. They provide a clear picture of inflation trends over time.
Both charts and graphs make complex data simple. They are essential for understanding the Excel Inflation Formula.
Practical Applications
Understanding the Excel Inflation Formula is crucial for many practical applications. This helps in various financial scenarios and ensures you stay ahead of economic changes. Let’s dive into two key practical applications: Budget Adjustments and Price Comparisons Over Time.
Budget Adjustments
Adjusting your budget for inflation is essential. You can use Excel to update past budgets to today’s value. This helps you compare past and present financial plans. Follow these steps:
- Enter your past budget data in one column.
- In the next column, apply the inflation rate using the formula:
=A2(1+inflation_rate). - Repeat for all relevant rows.
Your updated budget will reflect the current value, making it easier to plan ahead. This method ensures you don’t overspend or under-budget.
Price Comparisons Over Time
Comparing prices over time helps you understand purchasing power. You can use the Excel inflation formula to see how prices have changed. Here’s a simple method:
| Year | Price | Adjusted Price |
|---|---|---|
| 2010 | $100 | =B2(1+inflation_rate) |
| 2020 | $150 | =B3(1+inflation_rate) |
This table shows how prices change over the years. Using the formula, you can adjust historical prices to today’s value. This helps in making informed financial decisions.
Using Excel for these tasks is efficient and precise. You can easily update and compare your financial data. This ensures you stay on top of inflation and manage your finances better.

Credit: www.educba.com
Common Mistakes
Using the Excel Inflation Formula can be tricky. Many users make common mistakes that affect their results. This guide will help you identify and avoid these errors.
Avoiding Data Errors
Data errors can lead to incorrect inflation calculations. To avoid this, ensure your data is accurate and complete.
- Check for missing values: Fill in any gaps in your dataset.
- Verify data accuracy: Ensure all numbers are correct.
- Format cells properly: Use the correct number formats for dates and currency.
Here’s an example of how to format your data:
| Date       | Price  |
|------------|--------|
| 01/01/2020 | $100.00|
| 01/01/2021 | $105.00|
Misinterpretation Of Results
Many users misinterpret their results. Understanding your output is crucial.
- Know the formula: Familiarize yourself with the inflation formula you are using.
- Check your calculations: Ensure your formula is applied correctly.
- Understand the output: Know what the results mean.
Here’s an example formula:
= (New Price - Old Price) / Old Price * 100This formula calculates the percentage change in price. Make sure you use it correctly.
Frequently Asked Questions
What Is The Excel Inflation Formula?
The Excel inflation formula calculates the change in price over time using historical data and inflation rates.
How Do I Calculate Inflation In Excel?
Use the formula: `New Price = Old Price * (1 + Inflation Rate)` to calculate inflation in Excel.
What Is The Inflation Rate Formula?
The inflation rate formula is: `Inflation Rate = (New Price – Old Price) / Old Price`.
Can I Use Excel For Inflation Adjustments?
Yes, Excel can perform inflation adjustments using built-in functions and custom formulas.
Which Excel Function Calculates Inflation?
The `FV` (Future Value) function helps calculate inflation-adjusted prices in Excel.
How To Apply Inflation Formula In Excel?
Enter the inflation formula in a cell, replacing variables with actual values to get the result.
Conclusion
Mastering the Excel inflation formula empowers you to make informed financial decisions. It simplifies tracking economic changes. Use it to analyze trends and adjust budgets. Stay ahead in managing your finances by leveraging this powerful tool. Keep exploring Excel’s features for better data insights.

