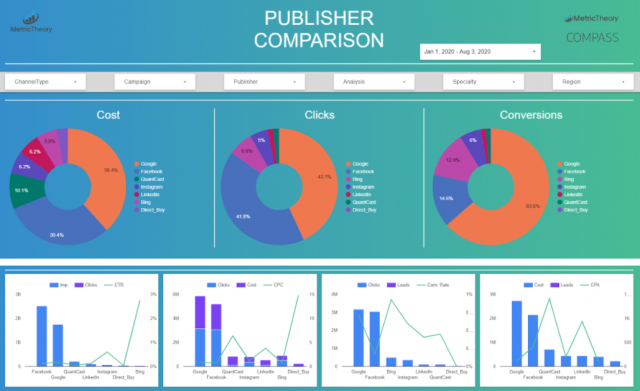
Free data visualization tools include Google Data Studio and Tableau Public. These tools help create interactive and insightful visual data representations.
Data visualization is crucial for interpreting complex data sets. Free tools like Google Data Studio and Tableau Public enable users to transform raw data into meaningful charts, graphs, and dashboards. These platforms offer user-friendly interfaces, making it easy for beginners to create visually appealing data presentations.
They support various data sources, ensuring flexibility in data integration. By using these tools, businesses can identify trends, patterns, and insights efficiently. This aids in making data-driven decisions, enhancing productivity, and optimizing strategies. Both tools have strong community support, offering tutorials and forums for troubleshooting and skill enhancement.
Introduction To Data Visualization
Data visualization transforms raw data into visual formats. This makes information more accessible. It helps people understand complex data quickly. Visual tools can include charts, graphs, and maps. Free tools make data visualization accessible to everyone.
Importance Of Data Visualization
Data visualization is crucial for several reasons. It simplifies complex data sets. People can grasp information faster with visuals. Visuals highlight trends and patterns. This aids in decision-making. It also helps in identifying correlations and outliers.
Key Benefits
There are many benefits to using data visualization tools:
- Easy Understanding: Visuals are easier to understand than raw data.
- Enhanced Decision-Making: Quick insights lead to better decisions.
- Spotting Trends: Visuals make it easy to see trends over time.
- Identifying Outliers: Outliers stand out clearly in charts and graphs.
- Engaging Presentations: Visuals make presentations more engaging.
| Feature | Description |
|---|---|
| Charts | Represent data with bars, lines, or pies. |
| Graphs | Show relationships between different data points. |
| Maps | Visualize geographical data effectively. |
Free data visualization tools are powerful. They offer features like charts, graphs, and maps. These tools help make sense of data easily. They are accessible and user-friendly. Start using these tools to unlock the power of your data.

Credit: www.pcmag.com
Criteria For Choosing Tools
Choosing the right data visualization tool can be challenging. There are many factors to consider. This section covers essential criteria like User-Friendliness and Customization Options. These aspects ensure you pick a tool that best suits your needs.
User-friendliness
A tool must be easy to use. You should not need advanced skills. Look for drag-and-drop features. A simple interface saves time. It also reduces the learning curve.
Consider tools with good user guides. Video tutorials can be very helpful. They make it easier to understand the tool. User-friendly tools increase productivity.
Customization Options
Customization allows you to tailor visualizations. Look for tools that offer various chart types. Options like bar, pie, and line charts are essential. The more chart types, the better.
Check if you can adjust colors and fonts. Customization helps match your brand style. It also makes data more readable. Flexible tools adapt to your specific needs.
| Criteria | Importance |
|---|---|
| User-Friendliness | High |
| Customization Options | High |
- User-Friendliness: Easy to use, simple interface, good user guides.
- Customization Options: Various chart types, adjustable colors, and fonts.
Top Free Data Visualization Tools
Data visualization tools turn raw data into visual stories. They help businesses and individuals understand data better. Here are some top free data visualization tools.
Tool 1: Features And Benefits
Tool 1 is a powerful free data visualization tool. It offers a variety of features to enhance your data analysis.
| Feature | Benefit |
|---|---|
| Easy to Use Interface | Helps beginners create visualizations quickly |
| Customizable Charts | Allows tailored data representation |
| Real-Time Data | Updates visualizations instantly |
- Drag and Drop Functionality: Simplifies the process of creating charts.
- Wide Range of Templates: Offers pre-designed templates for various data types.
Tool 2: Features And Benefits
Tool 2 is another excellent free option for data visualization. It also boasts several key features.
| Feature | Benefit |
|---|---|
| Interactive Dashboards | Engages users with interactive elements |
| Cloud Storage | Allows access to data from anywhere |
| Collaboration Tools | Enables team collaboration on visualizations |
- Data Import Options: Supports various data formats.
- Advanced Analytics: Provides deeper insights into the data.

Credit: medium.com
Comparison Of Tools
Data visualization tools are essential for making sense of complex data. Free tools offer many features but differ in ease of use and visual capabilities. Here, we compare some popular free data visualization tools.
Ease Of Use
Ease of use is crucial for users of all skill levels. Some tools are user-friendly, while others require advanced skills.
| Tool | Ease of Use |
|---|---|
| Google Data Studio | Very Easy |
| Tableau Public | Moderate |
| Chart.js | Requires Coding |
Visual Capabilities
Visual capabilities determine how well a tool can represent data visually. The more visual options, the better.
| Tool | Visual Options |
|---|---|
| Google Data Studio | Charts, Graphs, Maps |
| Tableau Public | Advanced Charts, Dashboards |
| Chart.js | Customizable Charts |
Free data visualization tools are diverse. They vary in ease of use and visual capabilities. Knowing these differences helps in choosing the right tool for your needs.
Case Studies
Case studies highlight the practical impact of free data visualization tools. Real-world examples show how these tools solve problems. Success stories demonstrate their potential for transforming data insights.
Case Study 1: Real-world Application
A small retail business used a free data visualization tool. They analyzed their sales data over 12 months.
The tool helped them identify peak sales periods. They adjusted inventory based on these insights, avoiding stockouts.
Key Benefits:
- Improved inventory management
- Better sales forecasting
- Increased customer satisfaction
Using the tool, they visualized customer demographics. This led to targeted marketing campaigns, increasing sales by 20%.
Case Study 2: Success Story
A nonprofit organization needed to present their impact data effectively. They chose a free data visualization tool for this task.
Challenges:
- Limited budget
- High data complexity
- Need for clear communication
The tool enabled them to create interactive charts and graphs. These visuals made their data accessible to donors and stakeholders.
Achievements:
- Increased donor engagement
- Clearer communication of impact
- Enhanced transparency
The organization saw a 30% rise in donations. This was a direct result of better data presentation.
Tips For Effective Visualization
Creating effective data visualizations can transform raw data into meaningful insights. It helps you understand trends, patterns, and outliers. Here are some tips for effective visualization using free tools.
Choosing The Right Charts
Selecting the right chart type is crucial for clear communication. Each chart type serves a different purpose. Here are some common chart types and their best uses:
| Chart Type | Best For |
|---|---|
| Bar Chart | Comparing categories |
| Line Chart | Showing trends over time |
| Pie Chart | Showing proportions |
| Scatter Plot | Identifying relationships |
Use bar charts for comparing different categories. Line charts are great for showing trends over time. Pie charts are best for displaying proportions within a whole. Scatter plots help identify relationships between variables.
Avoiding Common Pitfalls
Effective visualization avoids common pitfalls. These include clutter, misleading scales, and poor color choices. Follow these tips to avoid them:
- Keep it simple: Avoid adding unnecessary elements.
- Use clear labels: Ensure every axis and legend is labeled.
- Maintain accurate scales: Do not distort data with misleading scales.
- Choose colors wisely: Use a color palette that enhances readability.
Clutter can make your chart hard to read. Clear labels help viewers understand your data. Accurate scales ensure your data is not misleading. Good color choices improve readability and aesthetic appeal.
Future Trends
The world of data visualization tools is rapidly evolving. The future brings exciting changes and improvements. These tools will become more user-friendly and powerful. Let’s explore the future trends shaping this landscape.
Ai Integration
Artificial Intelligence (AI) is transforming data visualization. AI can automatically analyze and visualize data. This saves time and reduces human error. AI can also provide insights that are difficult to find manually. Here are some benefits of AI integration:
- Automated Insights: AI detects patterns and trends quickly.
- Predictive Analytics: AI predicts future trends based on historical data.
- Natural Language Processing (NLP): AI understands and processes human language.
AI integration is making data visualization more accessible. Even non-experts can now create complex visualizations.
Interactive Dashboards
Interactive dashboards are another trend in data visualization. They allow users to interact with data in real-time. This makes data exploration more engaging and intuitive. Features of interactive dashboards include:
| Feature | Description |
|---|---|
| Drill-Down | Users can explore data at different levels of detail. |
| Real-Time Updates | Dashboards reflect the latest data instantly. |
| Customizable Views | Users can tailor the dashboard to their needs. |
Interactive dashboards help in making quick decisions. They provide a comprehensive view of the data. This makes them essential for modern businesses.

Credit: www.shiksha.com
Frequently Asked Questions
What Are The Best Free Data Visualization Tools?
Some of the best free data visualization tools include Tableau Public, Google Data Studio, and Power BI. These tools offer robust features for creating interactive and insightful visualizations without any cost.
How Does Tableau Public Work?
Tableau Public allows users to create and share interactive data visualizations online. It is user-friendly and supports various data sources. While the tool is free, all published work is accessible to the public.
Is Google Data Studio Free?
Yes, Google Data Studio is completely free. It allows users to create interactive dashboards and reports. It integrates well with other Google services, making data connection seamless.
Can I Use Power Bi For Free?
Yes, Power BI offers a free version. It includes essential features for creating powerful visualizations and reports. The free version is suitable for individual users and small businesses.
Conclusion
Choosing the right data visualization tool can transform raw data into insightful visuals. Free tools offer great features for beginners and professionals. Start exploring these tools today to enhance your data analysis. Remember, effective visualization helps in making informed decisions.
Happy visualizing!


