
Analysis of Variance (ANOVA) in Excel helps compare means across multiple groups. It identifies significant differences between group averages.
ANOVA is a crucial statistical tool for researchers and analysts. It allows the examination of multiple datasets simultaneously. In Excel, conducting an ANOVA is straightforward, making it accessible for users of all skill levels. The tool helps determine whether the differences between group means are statistically significant.
This capability is essential for making informed decisions based on data. Users can quickly perform ANOVA using Excel’s built-in functions, ensuring accurate and efficient analysis. Understanding ANOVA in Excel enhances data analysis proficiency, providing valuable insights across various fields, including business, science, and social research.
Credit: www.excel-easy.com
Introduction To Anova
Analysis of Variance (ANOVA) is a powerful statistical tool. It helps to compare means among three or more groups. ANOVA is widely used in various fields like business, medicine, and engineering. In this section, we will discuss what ANOVA is and its importance in data analysis.
What Is Anova?
ANOVA stands for Analysis of Variance. It tests the hypothesis that the means of several groups are equal. ANOVA helps determine if there are any statistically significant differences between the means. It splits the total variation into two parts: within-group and between-group.
Here is a simple breakdown:
- Within-group variation: Variation within each group.
- Between-group variation: Variation between the different groups.
ANOVA uses the F-test to compare these variations. A high F-value indicates that there are significant differences between groups.
Importance In Data Analysis
ANOVA is crucial in data analysis. It helps to understand the differences between groups. This is especially important in experimental designs. ANOVA helps in making data-driven decisions. It is used in various fields like:
- Marketing: Compare the effectiveness of different campaigns.
- Medicine: Compare the effects of different treatments.
- Manufacturing: Compare the quality of products from different batches.
Here is a simple table showing the advantages of using ANOVA:
| Advantages | Description |
|---|---|
| Multiple Comparisons | Compare more than two groups simultaneously. |
| Efficiency | Reduces the risk of Type I errors. |
| Flexibility | Applicable to various experimental designs. |
Using ANOVA in Excel makes it accessible to many users. Excel provides tools to perform ANOVA easily. This makes it a preferred choice for many analysts.
Credit: www.youtube.com
Setting Up Your Data
Setting up your data correctly is the first step in performing an Analysis of Variance (ANOVA) in Excel. Proper data setup ensures accurate results. Follow these steps to prepare and format your data efficiently.
Preparing Data In Excel
Begin by opening a new or existing Excel worksheet. Your data should be organized in a tabular format.
- Place the dependent variable data in one column.
- Put the independent variable data in separate columns.
- Ensure each column has a header.
For example, if analyzing test scores from different classes, your data setup might look like this:
| Class A | Class B | Class C |
|---|---|---|
| 85 | 78 | 92 |
| 90 | 82 | 88 |
| 87 | 79 | 91 |
Formatting Requirements
Ensure your data meets the following formatting requirements:
- Remove any blank rows or columns.
- Ensure numerical data is in number format.
- Use consistent headers for each column.
Proper formatting is crucial for accurate ANOVA results. Double-check for any inconsistencies.
Here’s a quick checklist for formatting:
- Check for blank cells.
- Ensure consistent data types.
- Verify column headers.
Following these steps ensures that your ANOVA in Excel will run smoothly and give reliable results.
Using Excel For Anova
Analysis of Variance (ANOVA) is a crucial statistical tool. It helps to understand differences between group means. Excel offers a convenient way to perform ANOVA, making it accessible to many users.
Built-in Functions
Excel has built-in functions to perform ANOVA. The ANOVA feature is available in the Data Analysis Toolpak. You can access it through the Data tab. Here’s how:
- Click on the Data tab.
- Find the Data Analysis option.
- Select ANOVA: Single Factor or ANOVA: Two-Factor.
These steps allow you to perform a basic ANOVA test. Excel will generate a table with results. The table includes important statistics like F-value and p-value.
Add-ins And Tools
Excel also supports various add-ins and tools for advanced ANOVA. The Data Analysis Toolpak is the most commonly used. To activate the Toolpak:
- Go to the File menu.
- Select Options.
- Choose Add-ins.
- Click on Excel Add-ins and then Go.
- Check the Analysis Toolpak box and click OK.
Once activated, you can access it from the Data tab. This toolpak offers advanced options for ANOVA. It includes tools for Two-Factor ANOVA with replication and without replication.
Below is a table summarizing some key features:
| Feature | Description |
|---|---|
| ANOVA: Single Factor | Compares means across multiple groups. |
| ANOVA: Two-Factor with Replication | Tests two factors and their interaction. |
| ANOVA: Two-Factor without Replication | Tests two factors without interaction. |
These tools make Excel a powerful choice for ANOVA. They help users perform detailed statistical analysis with ease.
One-way Anova
One-Way ANOVA is a statistical test used to compare the means of three or more groups. It helps determine if there are significant differences between the groups. Using Excel, you can perform this test easily.
Steps To Perform
Follow these steps to perform a One-Way ANOVA in Excel:
- Prepare your data: Arrange your data in columns, each representing a group.
- Open the Data Analysis Tool: Go to the ‘Data’ tab and click ‘Data Analysis’.
- Select ANOVA: Choose ‘ANOVA: Single Factor’ and click ‘OK’.
- Input Range: Enter the range of your data, including headers.
- Grouping: Choose ‘Columns’ if your data is in columns.
- Output Range: Select where you want the results to appear.
- Run the analysis: Click ‘OK’ to run the analysis.
Interpreting Results
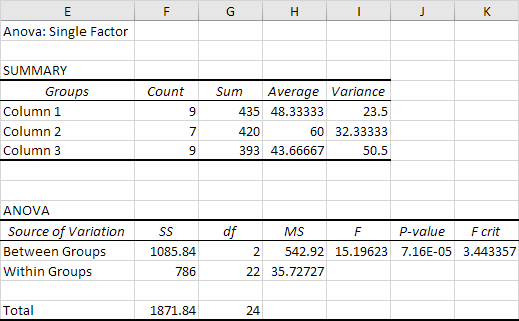
After running the analysis, Excel will generate a table with the results. Here is how to interpret them:
| Source of Variation | SS | df | MS | F | P-value | F crit |
|---|---|---|---|---|---|---|
| Between Groups | Value | Value | Value | Value | Value | Value |
| Within Groups | Value | Value | Value | Value | Value | Value |
- P-value: If the P-value is less than 0.05, the group means are significantly different.
- F-value: Compare the F-value with the F crit value. If the F-value is greater, the groups have significant differences.
Use these results to understand if there are significant differences between your groups.
Two-way Anova
Understanding Two-Way ANOVA is crucial for analyzing data with two factors. It helps determine if there is an interaction between the two factors affecting the outcome.
Steps To Perform
To carry out a Two-Way ANOVA in Excel, follow these steps:
- Open your Excel workbook and input your data into a table.
- Select the Data tab and click on Data Analysis.
- Choose Anova: Two-Factor With Replication and click OK.
- Fill in the required fields:
- Input Range: Select the range of your data.
- Rows per sample: Specify the number of rows.
- Alpha: Set the significance level (default is 0.05).
- Click OK to generate the ANOVA table.
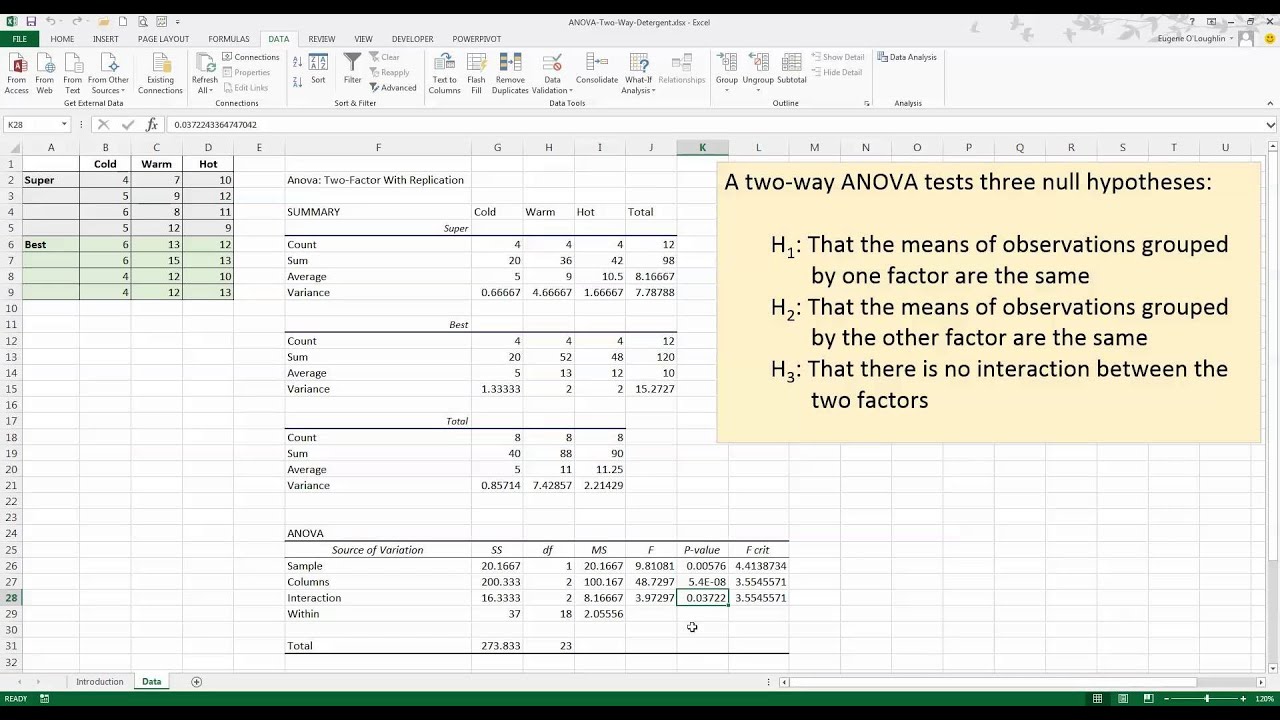
Interpreting Results
After performing the Two-Way ANOVA, you will see a table with the following columns:
Repeat for each source of variation
| Source of Variation | SS | df | MS | F | P-value | F crit |
|---|---|---|---|---|---|---|
| Sample | Sum of Squares | Degrees of Freedom | Mean Square | F-Statistic | P-Value | Critical Value of F |
P-value indicates the probability of observing the data. If the P-value is less than 0.05, it suggests a significant effect.
F-value helps compare the variation between groups. A higher F-value indicates greater variance.
F crit is the threshold value to determine significance. Compare it with the F-value to check the hypothesis.
Common Pitfalls
Analyzing variance in Excel is essential for data comparison. Yet, many users face common pitfalls. These issues can lead to incorrect results and faulty conclusions.
Data Assumptions
Correct analysis depends on accurate data assumptions. Homogeneity of variance is crucial. Ensure all groups have similar variance levels.
Another assumption is normality. Data should follow a normal distribution. Use histograms or Q-Q plots to verify.
Check for outliers. Outliers can distort results. Use the Boxplot tool in Excel to spot them.
Error Handling
Errors in data entry are common. Double-check your data for typos.
Ensure your range selections are correct. Incorrect ranges can lead to faulty analysis.
Watch out for missing values. Missing data can skew results. Fill them using Excel’s imputation tools.
Use error-checking functions like =IFERROR(). This can help manage unexpected errors.
| Common Pitfall | Solution |
|---|---|
| Incorrect Assumptions | Verify data normality and homogeneity |
| Data Entry Errors | Double-check and validate data |
| Incorrect Range Selection | Ensure accurate range selections |
| Missing Values | Use imputation tools |
Follow these tips to avoid common pitfalls. This ensures your ANOVA analysis in Excel is accurate and reliable.
Advanced Techniques
Understanding the basics of Analysis of Variance (ANOVA) in Excel is essential. But mastering advanced techniques can provide deeper insights. These techniques help you make more informed decisions. Let’s explore some of these advanced techniques.
Post-hoc Tests
Post-Hoc tests are important after running an ANOVA. They help identify which specific groups differ. This is essential when you have multiple groups.
- Tukey’s HSD (Honestly Significant Difference): This test compares all possible pairs of means. It helps find which groups are significantly different.
- Bonferroni Correction: This method adjusts the significance level. It prevents false positives when doing multiple comparisons.
- Scheffé’s Method: This test is more flexible. It applies to any number of comparisons, not just pairwise.
Multiple Comparisons
Multiple comparisons are used to compare more than two groups. This helps in understanding differences among several groups.
Here are some ways to handle multiple comparisons:
- ANOVA Table: Create an ANOVA table in Excel. It summarizes the variance among groups.
- p-Values: Look at p-values in the ANOVA table. A p-value less than 0.05 indicates significant differences.
- Effect Sizes: Calculate effect sizes to understand the magnitude of differences.
Below is an example of an ANOVA table:
| Source of Variation | Sum of Squares | Degrees of Freedom | Mean Square | F-Value | p-Value |
|---|---|---|---|---|---|
| Between Groups | SSB | dfB | MSB | F | p |
| Within Groups | SSW | dfW | MSW |
Learning these advanced techniques enhances your analysis skills. With these tools, you can derive meaningful insights from your data.
Case Studies
In this section, we will delve into real-world case studies to understand the practical applications of Analysis of Variance (ANOVA) in Excel. These examples will help you grasp the importance and utility of ANOVA in various fields.
Real-world Examples
ANOVA is widely used in business, healthcare, and research. Let’s explore some real-world examples to see how professionals use ANOVA in Excel.
- Business: A company wants to compare sales performance across different regions. They use ANOVA to determine if sales differ significantly between regions.
- Healthcare: Researchers analyze patient recovery times across different treatments. ANOVA helps to identify if any treatment leads to faster recovery.
- Education: Schools compare student test scores across different teaching methods. ANOVA shows if teaching methods impact student performance.
Lessons Learned
These case studies offer valuable insights. Let’s summarize the lessons learned from the real-world applications of ANOVA in Excel.
- Accuracy: ANOVA provides accurate comparisons between groups.
- Efficiency: Using Excel for ANOVA saves time and effort.
- Decision-Making: ANOVA aids in making data-driven decisions.
Understanding these lessons will help you apply ANOVA in your own projects effectively.
| Field | Application | Outcome |
|---|---|---|
| Business | Compare sales performance | Identify significant differences in sales |
| Healthcare | Analyze patient recovery times | Determine effective treatments |
| Education | Compare student test scores | Assess teaching methods |

Credit: mattchoward.com
Frequently Asked Questions
What Is Analysis Of Variance (anova) In Excel?
ANOVA in Excel is a statistical method used to compare means of three or more groups. It helps determine if there are significant differences between group means.
How Do You Perform Anova In Excel?
To perform ANOVA in Excel, use the Data Analysis Toolpak. Select “ANOVA” from the list, input your data range, and click OK.
What Are The Types Of Anova In Excel?
Excel supports several types of ANOVA: one-way ANOVA, two-way ANOVA, and ANOVA with replication. Each type has different applications.
Why Use Anova In Excel?
ANOVA is used in Excel to test hypotheses about differences between group means. It simplifies complex data comparison.
Conclusion
Mastering Analysis of Variance in Excel can significantly enhance your data analysis skills. This powerful tool simplifies comparing multiple data sets. Utilize Excel’s built-in functions to streamline your statistical processes. Start leveraging these techniques today to make informed, data-driven decisions with ease.
Explore ANOVA in Excel and boost your analytical capabilities.