
Excel Sensitivity Analysis helps evaluate how different values of an independent variable impact a particular dependent variable. It is crucial for decision-making and risk management.
Sensitivity analysis in Excel provides insights into how changes in input variables affect outputs in financial models. Businesses use this technique to forecast outcomes and prepare for various scenarios. Excel’s tools, such as Data Tables and Scenario Manager, simplify the process.
By identifying key variables and their potential impact, companies can make informed decisions. This analysis is essential for budgeting, financial planning, and strategic planning. It allows users to test assumptions and understand potential risks. Mastering sensitivity analysis in Excel enhances analytical skills and improves business forecasting accuracy.
Introduction To Sensitivity Analysis
Sensitivity analysis in Excel helps understand how different variables impact outcomes. It is a crucial tool for decision-making and forecasting. With it, you can predict changes and make informed choices.
Importance In Financial Forecasting
Sensitivity analysis is vital in financial forecasting. It helps predict how changes in variables affect financial outcomes. Businesses use it to plan and prepare for uncertainties. It can save companies from potential financial troubles.
- Risk Management: Identifies potential risks and prepares mitigation strategies.
- Better Decision Making: Provides insights for making informed decisions.
- Resource Allocation: Helps allocate resources efficiently and effectively.
Consider a company planning its budget. Sensitivity analysis can show how changes in sales or expenses affect profits. This ensures better financial planning and control.
Basic Concepts
Sensitivity analysis involves changing one variable at a time. This helps understand its impact on the outcome. For example, changing the interest rate in a loan calculation.
There are two main types:
- One-way Sensitivity Analysis: Change one variable while keeping others constant.
- Two-way Sensitivity Analysis: Change two variables simultaneously to see their combined effect.
Excel provides tools like Data Tables and Scenario Manager for sensitivity analysis. These tools simplify the process and provide clear results.
| Tool | Purpose |
|---|---|
| Data Tables | Analyze how changes in one or two variables affect outcomes. |
| Scenario Manager | Compare different scenarios and their impacts on results. |
Understanding these basic concepts helps in making effective use of sensitivity analysis. It empowers you to forecast accurately and make better decisions.
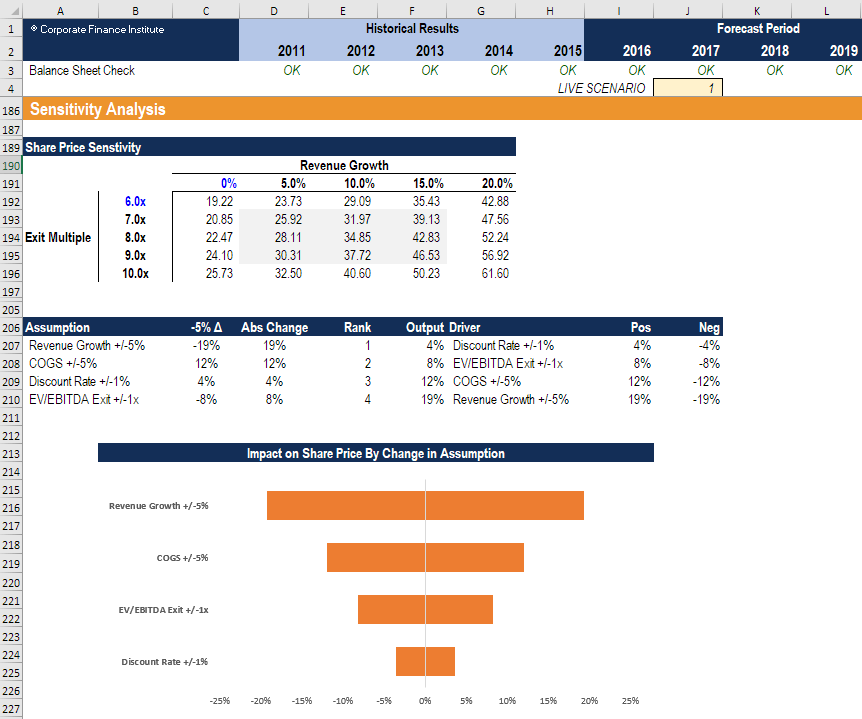
Credit: corporatefinanceinstitute.com
Setting Up Excel For Sensitivity Analysis
Conducting a sensitivity analysis in Excel can help you understand how different variables affect your outcome. This process involves setting up your data and using Excel’s tools to analyze it. Below, we’ll walk you through the steps to get started.
Preparing Your Data
Before diving into analysis, ensure your data is organized. Properly structured data makes it easier to apply Excel’s tools. Here are some steps to follow:
- List your variables in a clear, easy-to-read format.
- Label each column and row for quick reference.
- Ensure there are no empty cells within your data set.
For example, if you are analyzing sales data, your table might look like this:
| Month | Sales | Marketing Spend |
|---|---|---|
| January | 5000 | 2000 |
| February | 6000 | 2500 |
Using Data Tables
Excel’s data tables are a powerful tool for sensitivity analysis. They allow you to test multiple scenarios quickly. Here’s how to set one up:
- Select a cell to place your data table.
- Go to the Data tab and click What-If Analysis.
- Select Data Table from the dropdown menu.
- Enter the Row Input Cell and Column Input Cell.
In this way, you can see how changes in one or two variables affect your result. For example, you can test different sales and marketing spend scenarios to see their impact on profit.
Data tables make it easy to visualize potential outcomes and make informed decisions.
Creating Scenarios In Excel
Creating scenarios in Excel helps analyze different business outcomes. This is essential for effective decision-making. Using Excel’s Scenario Manager tool, you can easily define and compare various scenarios. Let’s dive into how you can create scenarios in Excel.
Scenario Manager Tool
The Scenario Manager Tool in Excel is simple to use. It’s found under the “Data” tab. This tool allows you to create and manage different scenarios. Scenarios can be used to analyze various possibilities. Here’s how to use it:
- Go to the “Data” tab.
- Click on “What-If Analysis”.
- Select “Scenario Manager”.
- Click “Add” to create a new scenario.
Each scenario can have different input values. This helps in comparing various outcomes. The tool is user-friendly and efficient.
Defining Different Scenarios
Defining different scenarios helps in analyzing multiple outcomes. You can create scenarios like Best Case, Worst Case, and Most Likely Case.
| Scenario | Input Values |
|---|---|
| Best Case | High sales, low costs |
| Worst Case | Low sales, high costs |
| Most Likely Case | Moderate sales, average costs |
To define these scenarios, follow these steps:
- Click “Add” in the Scenario Manager.
- Name your scenario (e.g., Best Case).
- Enter the input values for this scenario.
- Click “OK” and repeat for other scenarios.
Once you have defined the scenarios, you can switch between them to see different outcomes. This helps in visualizing the impact of different variables on your business.
Using Data Tables For Analysis
Excel Sensitivity Analysis helps you test different scenarios. Using data tables is a powerful way to do this. You can use one-variable or two-variable data tables. They make complex calculations easy. Let’s dive into each type.
One-variable Data Tables
One-variable data tables allow you to see how changes in one input affect your results. You can create a table to view multiple outcomes in one glance.
Follow these steps to create a one-variable data table:
- Enter your formula in a cell.
- List the variable values in a column or row.
- Select the range of cells, including the formula.
- Go to Data tab, then click on What-If Analysis.
- Choose Data Table.
- In the dialog box, enter the cell reference for your variable.
Example:
| Interest Rate | Monthly Payment |
|---|---|
| 3% | $500 |
| 4% | $550 |
| 5% | $600 |
Two-variable Data Tables
Two-variable data tables show how changes in two inputs affect your results. This gives you a more comprehensive view.
Steps to create a two-variable data table:
- Enter your formula in a cell.
- List one variable’s values in a column.
- List the other variable’s values in a row.
- Select the range of cells, including the formula.
- Go to Data tab, then click on What-If Analysis.
- Choose Data Table.
- In the dialog box, enter the cell references for both variables.
Example:
| Interest Rate | Loan Amount | Monthly Payment |
|---|---|---|
| 3% | $100,000 | $500 |
| 3% | $150,000 | $750 |
| 4% | $100,000 | $550 |
| 4% | $150,000 | $825 |
Using one-variable and two-variable data tables, you can easily see how different scenarios affect your results. This helps in making better decisions.
Advanced Techniques
Excel Sensitivity Analysis allows users to explore various outcomes by changing input variables. Mastering advanced techniques can enhance your data analysis. These techniques include Goal Seek Function and the Solver Add-In. Each offers unique benefits for refining your sensitivity analysis.
Goal Seek Function
The Goal Seek Function is an essential tool for sensitivity analysis. It helps you find the necessary input value to achieve a desired result. This function is ideal for simple, single-variable scenarios.
Here’s how to use the Goal Seek Function:
- Select the cell containing the formula.
- Navigate to the Data tab.
- Click on What-If Analysis and choose Goal Seek.
- Set the Set Cell to the formula cell.
- Enter the desired value in the To Value field.
- Specify the changing cell and click OK.
Goal Seek will iterate to find the needed input value. It adjusts the input to reach the desired output. This makes it a quick and easy method for simple sensitivity analysis.
Solver Add-in
The Solver Add-In is a powerful tool for complex scenarios. It can handle multiple variables and constraints, offering deeper insights. Unlike Goal Seek, Solver can optimize for maximum or minimum values.
Follow these steps to use the Solver Add-In:
- Ensure the Solver Add-In is enabled. Go to File > Options > Add-Ins.
- Select Solver Add-In and click Go. Then check the Solver Add-In box and click OK.
- Navigate to the Data tab and click Solver.
- Set the Objective cell, which contains the formula.
- Choose to Maximize, Minimize, or reach a specific Value.
- Specify the Changing Variable Cells.
- Define any Constraints and click Solve.
Solver will use advanced algorithms to find the optimal solution. This makes it indispensable for detailed and complex sensitivity analyses. You can refine your model by adjusting constraints and variables.
| Feature | Goal Seek | Solver Add-In |
|---|---|---|
| Use Case | Single-variable scenarios | Multi-variable and complex scenarios |
| Optimization | No | Yes |
| Ease of Use | Easy | Moderate |
| Customization | Low | High |
Understanding both Goal Seek and Solver Add-In can greatly improve your Excel sensitivity analysis. Each tool has its strengths, making them valuable for different types of analysis.

Credit: www.youtube.com
Interpreting Results
Excel Sensitivity Analysis helps you understand how changes in input values affect your results. Interpreting these results is crucial for decision-making. Let’s dive into the key aspects of analyzing sensitivity analysis results.
Analyzing Data Table Outputs
Data Table Outputs show how different inputs affect your results. They are visual representations of multiple scenarios. Here are steps to analyze them:
- Identify the input variables.
- Note the range of changes in each variable.
- Look for patterns in the outputs.
- Compare the results across different scenarios.
For example, if you have a table showing profit changes based on price and cost variations, you will see which combinations yield the highest profit. This helps in making informed decisions.
Scenario Summary Reports
Scenario Summary Reports aggregate results from multiple scenarios. They help in understanding the impact of different variables. To create and analyze these reports:
- Go to the Data tab.
- Select What-If Analysis.
- Choose Scenario Manager.
- Create different scenarios with varying inputs.
- Generate the summary report.
The report shows a side-by-side comparison of each scenario. This helps you quickly see which inputs lead to the best outcomes. For example, you can compare how different marketing strategies impact sales.
By using these tools, you can make data-driven decisions. Understanding Excel Sensitivity Analysis results leads to better outcomes.
Common Pitfalls And Solutions
Excel Sensitivity Analysis is a powerful tool for decision-making. But, it’s easy to make mistakes. This section highlights common pitfalls and their solutions.
Avoiding Errors
Errors can disrupt your analysis. Here are ways to avoid them:
- Check formulas: Ensure all formulas are correct.
- Validate data: Confirm the accuracy of input data.
- Use consistent units: Maintain uniform units across your data.
Consider using Excel’s built-in tools. The Auditing Toolbar helps trace errors. The Formula Evaluator helps understand complex formulas.
Best Practices
Following best practices can improve your sensitivity analysis:
- Use clear labels: Label all data points and variables.
- Separate data and calculations: Keep raw data and calculations in different sheets.
- Create a summary table: Summarize key results for easy reference.
Here is an example table for better clarity:
| Variable | Base Value | Changed Value |
|---|---|---|
| Sales Growth | 5% | 7% |
| Cost of Goods Sold | $50,000 | $55,000 |
Document assumptions: Always document the assumptions made during the analysis. Review regularly: Regularly review and update your analysis to reflect new data.
Real-world Applications
Understanding Excel Sensitivity Analysis in real-world applications transforms decision-making. This analysis helps businesses predict outcomes by varying key variables. It is essential for industries to evaluate risks and optimize strategies.
Case Studies
Several case studies highlight the power of Excel Sensitivity Analysis. These real-world examples showcase its practical benefits.
| Company | Scenario | Outcome |
|---|---|---|
| ABC Corp | Investment Analysis | Increased ROI by 20% |
| XYZ Ltd | Product Pricing | Optimized pricing strategy |
Industry Examples
Sensitivity Analysis is vital in various industries. Here are a few examples:
- Finance: Banks assess loan risks by varying interest rates.
- Healthcare: Hospitals predict patient inflow by adjusting seasonal factors.
- Retail: Stores optimize stock levels by changing demand assumptions.
- Manufacturing: Factories evaluate production costs by modifying raw material prices.
These examples demonstrate how Sensitivity Analysis aids in strategic planning. It helps organizations make informed decisions.
Credit: www.liveflow.io
Frequently Asked Questions
What Is Excel Sensitivity Analysis?
Excel Sensitivity Analysis examines how different input variables impact outcomes. It helps in decision-making by showing potential results. This analysis is vital for risk management and strategic planning.
How To Perform Sensitivity Analysis In Excel?
To perform Sensitivity Analysis, use Excel’s Data Table feature. It allows you to test different scenarios. Create a table with variables and results to visualize outcomes.
Why Use Sensitivity Analysis In Excel?
Sensitivity Analysis in Excel helps identify key variables affecting outcomes. It aids in risk assessment and strategic planning. This analysis enhances decision-making by showing potential impacts.
What Are The Benefits Of Sensitivity Analysis?
Sensitivity Analysis provides insights into variable impacts on results. It aids in risk management and strategic planning. It helps in making informed decisions by visualizing different scenarios.
Conclusion
Mastering Excel Sensitivity Analysis empowers your decision-making process. It helps you understand potential financial outcomes. This tool is essential for businesses and analysts. Enhance your skills by practicing regularly. Stay ahead in your field by leveraging Excel’s robust features. Sensitivity analysis is a game-changer in forecasting and planning.