
Regression analysis in Excel helps you understand relationships between variables by fitting a line to observed data points. It’s a powerful tool for making data-driven predictions.
Excel provides built-in functions to perform regression analysis, making it accessible to a broad audience. You can use the Data Analysis Toolpak, a free add-in, to conduct this analysis efficiently. By inputting your dataset, Excel calculates the regression equation, R-squared value, and other key statistics.
This feature is particularly valuable for businesses, researchers, and students who need to make informed decisions based on data. Understanding how to use regression analysis in Excel can significantly enhance your data analysis capabilities, allowing you to uncover trends and make accurate forecasts.
Introduction To Regression Analysis
Regression analysis is a powerful statistical tool. It helps to understand the relationship between variables. In Excel, regression analysis is easy to perform and visualize. This technique is valuable in various fields.
Importance In Data Science
In data science, regression analysis is crucial. It helps to predict future trends. Data scientists use it to analyze large datasets. The technique identifies patterns and relationships. This helps in making data-driven decisions.
- Predicting sales
- Analyzing market trends
- Optimizing business operations
Excel’s regression tools make these tasks simpler. It offers built-in functions and features. This saves time and effort for data scientists.
Real-world Applications
Regression analysis has many real-world applications. Businesses use it to forecast sales. Economists use it to study economic trends. Healthcare professionals use it to predict patient outcomes. Here are some examples:
| Field | Application |
|---|---|
| Finance | Stock price prediction |
| Marketing | Customer behavior analysis |
| Healthcare | Predicting disease outbreaks |
Each application benefits from regression analysis. It provides accurate predictions and insights. Excel makes it accessible to everyone.
Credit: www.youtube.com
Setting Up Excel For Analysis
Setting up Excel for regression analysis is crucial. Follow these steps to ensure accuracy and efficiency. This guide will help you get started.
Necessary Add-ins
Excel needs specific add-ins for regression analysis.
- Click on the File tab.
- Select Options.
- Choose Add-ins.
- Find Analysis ToolPak in the list.
- Click Go next to Manage.
- Check the box for Analysis ToolPak.
- Click OK.
Now, the Analysis ToolPak is active. You can use it for regression analysis.
Data Preparation
Proper data preparation is essential for accurate analysis.
- Ensure data is clean and free of errors.
- Remove any empty cells or rows.
- Label your columns clearly.
- Ensure numerical data is formatted correctly.
- Sort your data if necessary.
| Step | Description |
|---|---|
| 1 | Ensure data is clean |
| 2 | Remove empty cells |
| 3 | Label columns clearly |
| 4 | Check numerical formatting |
| 5 | Sort data if needed |
Following these steps ensures your data is ready for analysis. Clean data leads to accurate results.
Types Of Regression Models
Regression analysis in Excel helps understand relationships between variables. Different types of regression models cater to diverse data scenarios. Here, we explore the most common models: Linear Regression and Multiple Regression.
Linear Regression
Linear Regression is the simplest form of regression analysis. It helps predict a dependent variable based on one independent variable. The relationship between the variables is linear.
In Excel, you can use the SLOPE and INTERCEPT functions for linear regression. These functions help find the best-fit line.
The formula for a linear regression line is:
y = mx + cWhere:
- y is the dependent variable.
- m is the slope of the line.
- x is the independent variable.
- c is the intercept.
Excel also offers a built-in tool for linear regression. You can find it under the Data Analysis Toolpak.
Multiple Regression
Multiple Regression involves more than one independent variable. It helps predict a dependent variable based on multiple predictors. This model is useful for complex data scenarios.
In Excel, you can use the LINEST function for multiple regression. This function returns an array of values that describe the regression line.
The formula for a multiple regression model is:
y = b0 + b1x1 + b2x2 + ... + bnxnWhere:
- y is the dependent variable.
- b0 is the intercept.
- b1, b2, …, bn are the coefficients.
- x1, x2, …, xn are the independent variables.
Excel’s Data Analysis Toolpak also supports multiple regression analysis. You can access it through the Regression option.
Credit: cameron.econ.ucdavis.edu
Performing Linear Regression In Excel
Performing linear regression in Excel is straightforward and powerful. It helps users analyze relationships between variables. This process can provide valuable insights for data-driven decisions.
Step-by-step Guide
Follow this simple guide to perform linear regression in Excel:
- Open Excel: Launch Excel and open your data file.
- Prepare Data: Ensure your data is in two columns. One for the independent variable (X) and one for the dependent variable (Y).
- Select Data: Highlight the data range including headers.
- Insert Scatter Plot: Go to the Insert tab, click Scatter in the Charts group, and choose Scatter with only Markers.
- Add Trendline: Click on any data point in the scatter plot. Then, click Add Trendline from the context menu.
- Configure Trendline: In the Format Trendline pane, select Linear. Check the boxes for Display Equation on chart and Display R-squared value on chart.
Interpreting Results
Understanding the results is crucial for making informed decisions:
| Element | Explanation |
|---|---|
| Slope | The slope indicates the rate of change of Y with respect to X. |
| Intercept | The intercept is the value of Y when X is zero. |
| R-squared Value | The R-squared value shows how well the data fits the regression model. An R-squared value closer to 1 means a better fit. |
Linear regression in Excel is an essential tool for data analysis. It helps identify trends and make predictions based on data.
Multiple Regression In Excel
Multiple Regression in Excel is a powerful tool for analyzing the relationship between multiple independent variables and a dependent variable. This technique helps in understanding how changes in the independent variables impact the dependent variable, allowing for more accurate predictions and insights.
Data Requirements
Before performing multiple regression in Excel, ensure your data meets specific criteria:
- Data should be in a tabular format.
- Each column represents a variable.
- Rows represent different observations.
- Ensure there are no missing values.
Here is an example table:
| Variable 1 | Variable 2 | Variable 3 | Dependent Variable |
|---|---|---|---|
| 10 | 15 | 20 | 50 |
| 12 | 18 | 22 | 60 |
| 14 | 20 | 25 | 70 |
Analysis Procedure
Follow these steps to perform multiple regression in Excel:
- Open Excel and enter your data.
- Go to the “Data” tab.
- Click “Data Analysis” in the “Analysis” group.
- Select “Regression” and click “OK”.
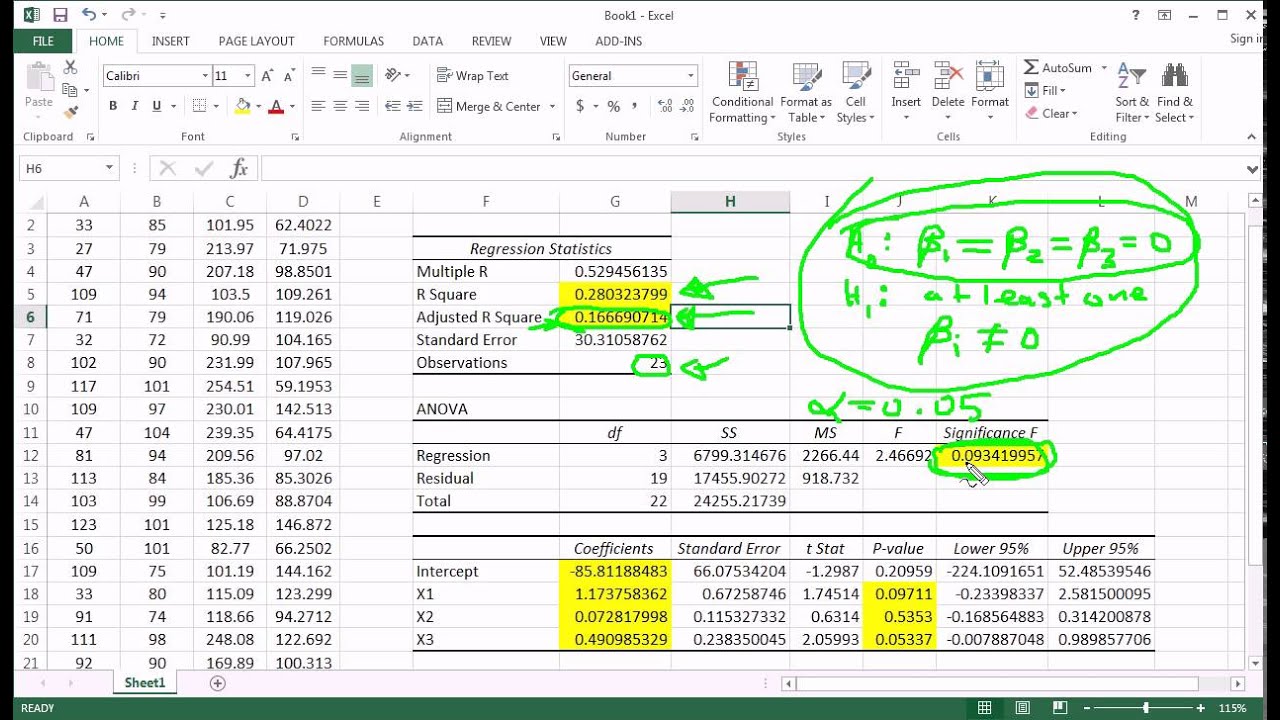
In the Regression dialog box:
- Input Y Range: Select the dependent variable column.
- Input X Range: Select the independent variables columns.
- Check “Labels” if your data includes headers.
- Choose an output range or new worksheet.
Click “OK” to run the regression. Excel will generate a summary output, including coefficients, R-squared value, and p-values for each variable.

Credit: www.ablebits.com
Advanced Regression Techniques
Advanced regression techniques in Excel can unlock deeper insights from your data. These methods go beyond basic linear regression, offering more flexibility and precision.
Polynomial Regression
Polynomial regression models relationships that are not linear. It’s useful for data that follows a curve. Excel makes it easy to perform polynomial regression.
- Step 1: Arrange your data in two columns.
- Step 2: Select the data and insert a scatter plot.
- Step 3: Add a trendline to the chart.
- Step 4: Choose the polynomial option and set the order.
Excel calculates the polynomial equation for you. This helps in understanding complex data patterns.
Logistic Regression
Logistic regression is used for binary outcomes. It predicts the probability of an event occurring. Excel’s built-in tools can perform logistic regression.
- Step 1: Prepare your binary outcome data.
- Step 2: Use Excel’s Solver add-in for optimization.
- Step 3: Set up the logistic regression formula.
- Step 4: Run the Solver to find the best-fit parameters.
The logistic function outputs values between 0 and 1. This makes it ideal for classification tasks.
Common Pitfalls And Solutions
Regression Analysis in Excel is a powerful tool. It helps in predicting outcomes based on data. Yet, several common mistakes can affect the accuracy of your analysis. Knowing these pitfalls and their solutions can improve your results.
Avoiding Overfitting
Overfitting happens when your model is too complex. It fits the training data too well, capturing noise instead of the actual trend. This leads to poor performance on new data. To avoid overfitting:
- Simplify your model: Use fewer predictors.
- Cross-validate: Split your data into training and test sets.
- Use regularization techniques: Apply Lasso or Ridge regression.
These methods ensure your model generalizes well. It performs better on unseen data.
Handling Multicollinearity
Multicollinearity occurs when predictor variables are highly correlated. It makes it hard to determine the effect of each predictor. This can lead to unreliable estimates. To handle multicollinearity:
- Check correlation matrix: Identify highly correlated variables.
- Remove redundant predictors: Drop one of the correlated variables.
- Use Principal Component Analysis (PCA): Transform correlated predictors into uncorrelated components.
By addressing multicollinearity, your model becomes more reliable. It provides clearer insights into the relationships between variables.
Visualizing Regression Results
Visualizing regression results in Excel helps to understand the data trends. It allows you to see patterns and make predictions. Let’s explore how to create scatter plots and use trendlines in Excel.
Creating Scatter Plots
A scatter plot shows the relationship between two variables. It uses dots to represent data points. Follow these steps to create a scatter plot in Excel:
- Open your Excel spreadsheet with your data.
- Select the data you want to plot.
- Go to the Insert tab.
- Click on the Scatter chart icon.
- Choose the Scatter with only Markers option.
Your scatter plot will appear on the spreadsheet. You can now see the data points clearly. This visual representation helps identify any patterns or outliers.
Using Trendlines
Trendlines show the general direction of data. They help in understanding the relationship between variables. To add a trendline to your scatter plot:
- Click on any data point in your scatter plot.
- Right-click and select Add Trendline.
- Choose the type of trendline you need, such as Linear or Exponential.
- Check the Display Equation on chart box if you want the formula.
- Click Close to apply the trendline.
Now, your scatter plot will have a trendline. This helps in predicting future values. It also makes it easier to see the overall trend of your data.
Practical Tips And Tricks
Excel offers powerful tools for regression analysis. Understanding practical tips can save time. Optimize your workflow with these tricks.
Automating Tasks With Macros
Macros automate repetitive tasks. Record your actions and replay them. This saves time during data analysis.
To create a macro:
- Go to the “Developer” tab.
- Click “Record Macro.”
- Perform your actions.
- Click “Stop Recording.”
Run your macro by pressing the assigned shortcut. Macros make regression analysis faster.
Using Excel Functions
Excel functions simplify regression analysis. Use the LINEST function for linear regression.
Here is how to use the LINEST function:
- Select a range of cells.
- Type
=LINEST(known_y's, [known_x's], [const], [stats]). - Press Ctrl+Shift+Enter for an array formula.
The LINEST function provides regression coefficients. These coefficients help in predicting values.
For polynomial regression, use the LOGEST function. This function fits an exponential curve to your data.
Excel functions enhance your regression analysis. They make calculations easier and faster.
| Function | Description |
|---|---|
| LINEST | Performs linear regression analysis. |
| LOGEST | Performs exponential regression analysis. |
| FORECAST | Predicts future values based on past data. |
Using these functions saves time. They also improve accuracy in your regression analysis.
Frequently Asked Questions
What Is Regression Analysis In Excel?
Regression analysis in Excel is a statistical method. It helps identify relationships between variables. Excel’s built-in tools make it easy to perform.
How Do You Run Regression In Excel?
To run regression in Excel, use the Data Analysis Toolpak. Select “Regression” and input your data ranges. Click “OK” to generate results.
Why Use Excel For Regression Analysis?
Excel simplifies regression analysis with its user-friendly interface. It provides quick visualizations and accurate results. It’s ideal for beginners and professionals.
Can Excel Perform Multiple Regression Analysis?
Yes, Excel can perform multiple regression analysis. Use the Data Analysis Toolpak. Input multiple independent variables for comprehensive results.
Conclusion
Mastering regression analysis in Excel empowers you to make data-driven decisions. It’s a crucial skill for analyzing trends. Practice regularly to enhance your proficiency. Understanding the fundamentals can significantly impact your business insights. Start applying regression analysis techniques today and see the difference in your data interpretations.