
To calculate percent change in Excel, use the formula: ((New Value – Old Value) / Old Value) * 100. This will give you the percentage change.
Calculating percent change in Excel is a straightforward process that helps track growth or decline over time. This function is essential for financial analysis, sales tracking, and performance measurement. Excel’s formula capabilities streamline this task, making data analysis efficient. Understanding how to compute percent change can greatly enhance data interpretation skills.
Users can quickly identify trends and make informed decisions based on accurate data. Mastering this simple yet powerful tool can improve productivity and analytical capabilities. Excel’s versatility ensures that percent change calculations are both quick and reliable.
Introduction To Percent Change
Understanding percent change is crucial in many fields. It helps track growth, reduction, and trends. Percent change measures the difference between two values as a percentage of the original value. It provides a clearer picture than raw numbers.
Importance Of Percent Change
The importance of percent change cannot be overstated. It is vital in finance, business, and data analysis. It helps in comparing performances, tracking progress, and making informed decisions. With percent change, you can easily see if values are increasing or decreasing.
Here are some key reasons why percent change is important:
- Simplifies comparison between different data sets.
- Helps in identifying trends over time.
- Useful in financial analysis for tracking stock prices and investments.
- Important for business growth metrics like sales and revenue.
Common Use Cases
Percent change is widely used in various scenarios. Here are some common use cases:
- Stock Market: Investors track percent change in stock prices.
- Sales Analysis: Businesses monitor sales growth or decline.
- Academic Performance: Schools compare year-on-year student performance.
- Health Statistics: Authorities track changes in health metrics like infection rates.
In Excel, calculating percent change involves simple formulas. This makes analysis efficient and accurate. Here’s a basic formula for calculating percent change:
Percent Change = ((New Value - Old Value) / Old Value) 100Using this formula in Excel is easy. You can automate calculations and visualize data effectively.
Setting Up Your Excel Sheet
To calculate percent change in Excel, start by setting up your sheet correctly. Proper setup ensures accurate and quick calculations. Follow these steps to get started.
Entering Data
First, enter your data in the Excel sheet. Use clear and concise labels for each column.
- Column A: Dates (e.g., Jan 1, Jan 2)
- Column B: Values (e.g., Sales, Prices)
Ensure each row matches the correct date and value. This helps maintain accuracy.
Formatting Cells
Proper cell formatting makes your data readable. Select the cells you want to format.
Apply the appropriate format:
- Dates: Select Date format.
- Values: Choose Number or Currency format.
This ensures your data is clear and easy to understand.
Here is a sample table setup:
| Date | Value |
|---|---|
| Jan 1 | 100 |
| Jan 2 | 120 |
With your data entered and formatted, you are ready to calculate percent change.
Basic Percent Change Formula
Understanding the Basic Percent Change Formula in Excel is essential for data analysis. This formula helps you measure the change between two values. Whether tracking sales growth or analyzing trends, mastering this formula can be very useful. Let’s dive into the details.
Formula Structure
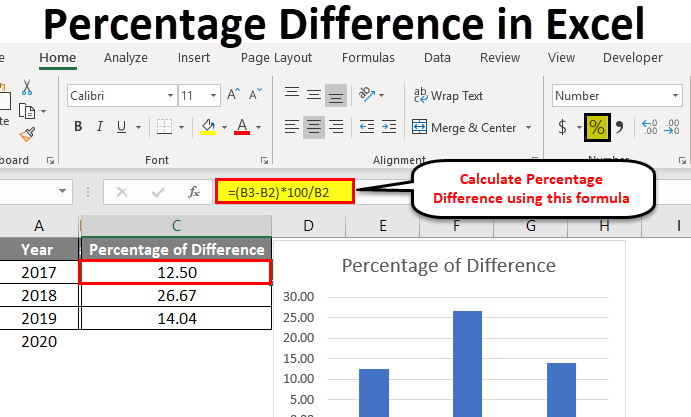
The percent change formula calculates the relative change between two values. The formula is:
Percent Change = ((New Value - Old Value) / Old Value) * 100
Here is how each part works:
- New Value: The value after the change.
- Old Value: The value before the change.
- Subtract: Find the difference between the new and old values.
- Divide: Divide the difference by the old value.
- Multiply: Multiply by 100 to get a percentage.
Example Calculation
Let’s look at an example to understand this better:
| Old Value | New Value | Percent Change |
|---|---|---|
| 50 | 75 | 50% |
In this example:
- The Old Value is 50.
- The New Value is 75.
- Calculate the difference:
75 - 50 = 25 - Divide by the old value:
25 / 50 = 0.5 - Multiply by 100:
0.5 100 = 50%
So, the percent change is 50%.
This formula is easy to use in Excel. Just input the values and apply the formula. This will help you get quick and accurate results.
Using Built-in Excel Functions
Excel provides built-in functions to calculate percent change. These functions simplify the process. Understanding how to use these functions can save time and effort. Let’s explore how you can do this using Excel’s built-in features.
Using The ‘percentage’ Format
Excel’s ‘Percentage’ format is handy for displaying percent change.
- Select the cells with your data.
- Right-click and choose ‘Format Cells’.
- Select ‘Percentage’ from the list.
- Click ‘OK’ to apply the format.
Applying the ‘Percentage’ format makes your data easier to read. It converts decimal values to percentages automatically.
Leveraging The ‘change’ Function
Excel does not have a built-in ‘Change’ function, but you can create one.
Follow these steps to calculate percent change:
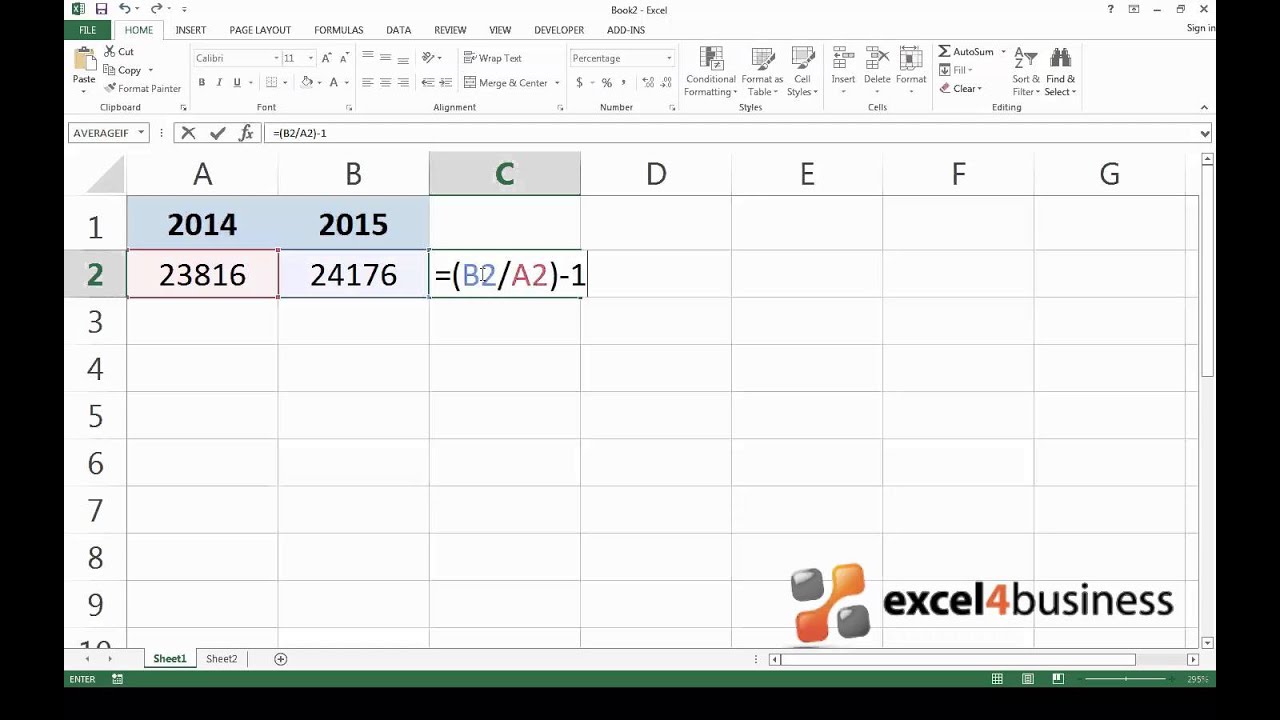
- Enter the initial value in cell A1.
- Enter the new value in cell B1.
- In cell C1, enter the formula:
=((B1-A1)/A1)100 - Press ‘Enter’ to see the result.
This formula calculates the percent change between two values. The result in cell C1 will show the percent change.
| Initial Value | New Value | Percent Change |
|---|---|---|
| 50 | 75 | 50% |
| 100 | 150 | 50% |
The table above shows sample calculations. Use it to verify your results.
Handling Different Data Sets
Calculating percent change in Excel can be easy. Different data sets need different methods. Here, we will discuss monthly and yearly data sets. Understanding these methods will help you handle various data easily.
Monthly Data
Monthly data sets are common in business and finance. Let’s say you have sales data for each month. Follow these steps to calculate percent change:
- Open your Excel sheet with monthly data.
- In a new column, type the formula for percent change.
- The formula is:
=((New Value - Old Value) / Old Value) * 100 - Drag the formula down to apply it to all rows.
Example:
| Month | Sales | Percent Change |
|---|---|---|
| January | 1000 | |
| February | 1200 | =((1200-1000)/1000)100 |
Remember to use absolute cell references if needed.
Yearly Data
Yearly data sets help track long-term trends. Imagine you have yearly revenue data. Follow these steps for percent change:
- Open your Excel sheet with yearly data.
- Type the percent change formula in a new column.
- The formula is:
=((New Value - Old Value) / Old Value) * 100 - Copy the formula to all relevant rows.
Example:
| Year | Revenue | Percent Change |
|---|---|---|
| 2020 | 50000 | |
| 2021 | 60000 | =((60000-50000)/50000)100 |
Ensure your data is clean. This will improve accuracy.

Credit: www.wallstreetmojo.com
Common Mistakes To Avoid
Calculating percent change in Excel can be tricky. Many users make common mistakes. Avoid these to get accurate results. Below are the most common mistakes to watch out for.
Incorrect Formula Usage
Using the wrong formula is a big mistake. The correct formula for percent change is:
=((New Value - Old Value) / Old Value) * 100Make sure you use this formula. Any variation can give wrong results. Double-check your formula to avoid errors.
Here is an example:
| Old Value | New Value | Percent Change |
|---|---|---|
| 50 | 75 | =((75-50)/50)100 = 50% |
Data Entry Errors
Data entry errors can ruin your calculations. Always enter data carefully. A small typo can change your results.
Here are some tips to avoid data entry errors:
- Double-check your data
- Use data validation tools
- Keep your data organized
Use Excel’s built-in features to avoid mistakes. This helps keep your data accurate.
Remember, accurate data is key for correct percent change calculations.
Advanced Tips And Tricks
Calculating percent change in Excel is a basic skill. But many users overlook advanced tips and tricks. These tricks can make your work easier and more efficient. This section will cover Conditional Formatting and Using Pivot Tables.
Conditional Formatting
Conditional formatting highlights cells based on their values. This feature can make percent changes stand out.
- First, select the cells with the percent changes.
- Next, go to the Home tab and click on Conditional Formatting.
- Then, choose New Rule.
- After that, select Format cells that contain.
- Now, enter a condition for the percent change, like greater than 10%.
- Finally, choose a formatting style, like a bold font or color change.
Your percent changes will now be easier to see. This helps identify key data points quickly.
Using Pivot Tables
Pivot Tables are powerful tools in Excel. They summarize large data sets efficiently.
To use Pivot Tables for percent change:
- Select your data range.
- Go to the Insert tab and click on Pivot Table.
- Choose the location for your Pivot Table, either new worksheet or existing.
- Drag and drop fields into the Rows and Values areas.
- Right-click on a value and select Show Values As.
- Choose % Difference From to calculate percent change.
This method creates a dynamic summary of percent changes. You can quickly analyze trends and patterns.
Credit: www.youtube.com
Practical Applications
Calculating percent change in Excel has many practical uses. This tool helps in various fields, including business analytics and personal finance. Knowing these applications can make your life easier and more productive.
Business Analytics
Businesses use percent change to track performance. It helps in understanding growth or decline in key metrics.
Sales Data: You can use percent change to compare sales figures over different periods.
- Track monthly, quarterly, or yearly sales growth.
- Identify trends and make data-driven decisions.
Market Analysis: Analysts often use percent change to study market trends.
- Evaluate stock price movements.
- Analyze customer behavior over time.
Here’s a simple example in a table:
| Month | Sales | Percent Change |
|---|---|---|
| January | $10,000 | – |
| February | $12,000 | 20% |
Personal Finance
Managing personal finances becomes easier with percent change calculations.
Budgeting: Track changes in your expenses and income.
- Identify areas where spending has increased or decreased.
- Adjust your budget based on these changes.
Investments: Keep an eye on your investment growth or loss.
- Calculate percent change in your portfolio’s value.
- Make informed decisions based on these changes.
Here’s an example:
| Month | Investment Value | Percent Change |
|---|---|---|
| January | $5,000 | – |
| February | $5,500 | 10% |
Credit: www.educba.com
Frequently Asked Questions
How Do You Calculate Percent Change In Excel?
To calculate percent change in Excel, use the formula \((\text{New Value – Old Value}) / \text{Old Value} * 100\). This formula gives you the percentage increase or decrease between two numbers.
What Is The Formula For Percent Change?
The formula for percent change is \((\text{New Value – Old Value}) / \text{Old Value} * 100\). This calculates the percentage difference between two values.
Can Excel Calculate Percentage Differences?
Yes, Excel can calculate percentage differences. Use the formula \((\text{New Value – Old Value}) / \text{Old Value} * 100\) in a cell.
How To Show Percent Change In Excel?
To show percent change, enter the formula \((\text{New Value – Old Value}) / \text{Old Value} * 100\). Format the cell as a percentage.
Conclusion
Mastering percent change in Excel can boost your data analysis skills. This guide simplifies the process for you. Practice these steps to improve efficiency. Accurate calculations lead to better decisions. Keep refining your Excel expertise to stay ahead. Happy calculating!