
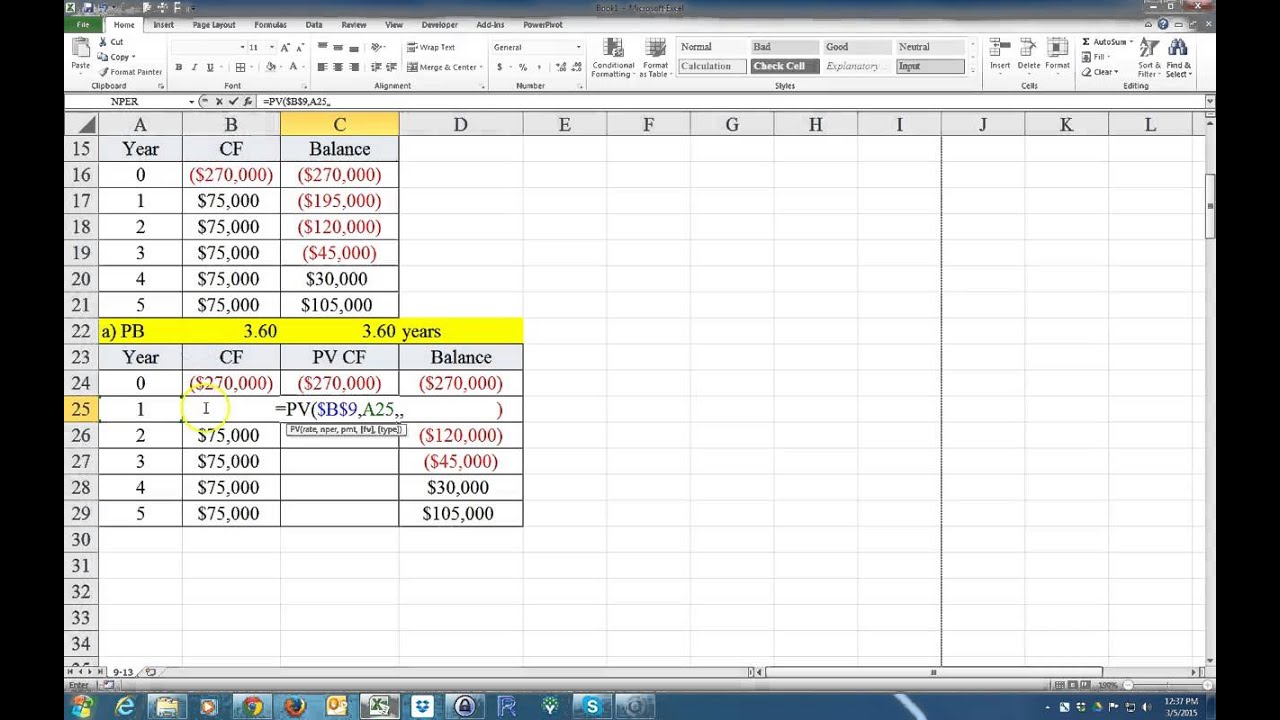
To calculate the payback period in Excel, use the formula: `=Year + (Cumulative Cash Flow / Cash Flow of Next Year)`. This method helps determine the time needed to recover an investment.
The payback period is a crucial metric in finance and business. It measures the time required for an investment to generate enough cash flow to cover its initial cost. Investors and managers rely on this period to assess the viability and risk associated with projects.
Using Excel to calculate the payback period is efficient and straightforward. The formula provided simplifies the process, offering quick insights into the investment’s recovery time. Understanding the payback period aids in making informed financial decisions, ensuring resources are allocated to the most promising ventures. This metric ultimately helps in optimizing investment strategies and enhancing profitability.

Credit: m.youtube.com
Introduction To Payback Period
The payback period is a crucial concept in financial analysis. It helps businesses understand how long it will take to recover an investment. Using Excel to calculate the payback period can streamline this process and provide accurate results.
Definition
The payback period is the time needed to recoup an initial investment. It is a simple way to assess the risk of an investment. In Excel, you can easily calculate the payback period using basic formulas.
Importance In Financial Analysis
Understanding the payback period is vital for making informed financial decisions. It helps investors and managers evaluate the profitability of projects. Here are a few reasons why the payback period is important:
- Identifies the risk involved in investments.
- Helps in comparing different projects.
- Assists in cash flow management.
Using Excel for calculating the payback period can save time and reduce errors. Excel offers functions and formulas that make this task straightforward. Below is a simple formula to calculate the payback period:
=Initial_Investment / Annual_Cash_Flow
By inputting your values into this formula, you can quickly determine your payback period. Excel also allows for more complex calculations if needed.

Credit: www.fm-magazine.com
Basic Payback Period Formula
The Basic Payback Period Formula helps businesses determine how long it takes to recover an investment. It’s a simple yet powerful tool. In Excel, this formula becomes even more accessible. Let’s dive into the details.
Formula Breakdown
The basic payback period formula is:
Payback Period = Initial Investment / Annual Cash Inflows
Here’s a breakdown:
- Initial Investment: The total amount spent on the project.
- Annual Cash Inflows: The yearly earnings from the investment.
Example Calculation
Let’s look at an example in Excel:
Assume a project with:
| Item | Amount |
|---|---|
| Initial Investment | $10,000 |
| Annual Cash Inflows | $2,500 |
To calculate the payback period in Excel:
- Enter the initial investment in cell A1.
- Enter the annual cash inflows in cell A2.
- In cell A3, use the formula:
=A1/A2
This will give you the payback period:
Payback Period = 10,000 / 2,500 = 4 years
Setting Up Excel For Financial Analysis
Excel is a powerful tool for financial analysis. It helps you calculate the payback period for investments. Setting up Excel properly ensures accuracy and efficiency.
Excel Basics
To start, you need to understand some basic Excel features. These features make financial analysis easier.
- Cells: The building blocks of Excel. Each cell can hold data.
- Rows and Columns: Organized in a grid. Columns are labeled A, B, C, etc. Rows are numbered 1, 2, 3, etc.
- Formulas: Excel uses formulas to perform calculations. Formulas begin with an equal sign (=).
Familiarize yourself with these basics. They are crucial for setting up your financial analysis.
Essential Functions
Excel has many functions that are essential for financial analysis. Here are some key functions:
| Function | Description |
|---|---|
| SUM | Adds numbers in a range of cells. |
| AVERAGE | Calculates the average of numbers in a range. |
| NPV | Calculates the net present value of an investment. |
| IRR | Calculates the internal rate of return for an investment. |
These functions are vital for calculating the payback period. They help you perform complex calculations easily.
Here is an example formula to calculate NPV:
=NPV(rate, value1, [value2], ...)Replace “rate” with the discount rate. Replace “value1”, “value2”, etc., with your cash flow values.
By mastering these functions, you can set up Excel for effective financial analysis.
Creating A Payback Period Calculator In Excel
Creating a Payback Period Calculator in Excel is a valuable skill. It helps in quick financial analysis. This tool can determine the time needed to recover an investment. Follow this guide to build a simple yet effective calculator.
Step-by-step Guide
Let’s start by setting up our data in Excel. Follow these steps:
- Open Excel and create a new worksheet.
- Label the columns as follows:
- Year
- Cash Flow
- Cumulative Cash Flow
- Enter the yearly cash flows in the “Cash Flow” column.
- Calculate cumulative cash flow in the “Cumulative Cash Flow” column.
Using Built-in Functions
Excel offers built-in functions to simplify this process. Use the =SUM() function to calculate cumulative cash flow.
Here’s how to do it:
- In the first cell of the “Cumulative Cash Flow” column, type:
=B2 - In the next cell, type:
=B3+C2 - Drag the formula down to fill the remaining cells.
Next, determine the payback period:
- Identify the year when the cumulative cash flow turns positive.
- Calculate the exact payback period using linear interpolation if needed.
For more precision, use the =MATCH() function:
=MATCH(TRUE, C2:C10>0, 0)
This formula returns the exact year when the investment is recovered.
Advanced Techniques
Mastering the Payback Period Formula in Excel can save you time. Advanced techniques make your calculations even more accurate. In this section, we dive into two advanced techniques: incorporating cash flows and handling irregular payments.
Incorporating Cash Flows
To calculate the payback period, you need to account for cash flows. Create a table in Excel to organize your data. Use the following columns:
- Year
- Cash Inflow
- Cumulative Cash Flow
Here’s a simple example:
| Year | Cash Inflow | Cumulative Cash Flow |
|---|---|---|
| 1 | $5,000 | $5,000 |
| 2 | $7,000 | $12,000 |
| 3 | $8,000 | $20,000 |
Use the SUM function to calculate cumulative cash flow. This helps you determine when your initial investment is recovered.
Handling Irregular Payments
Irregular payments make calculations tricky. Create a detailed cash flow table. Include every irregular payment. Here’s an example:
| Year | Cash Inflow | Cumulative Cash Flow |
|---|---|---|
| 1 | $5,000 | $5,000 |
| 2 | $3,000 | $8,000 |
| 3 | $10,000 | $18,000 |
| 4 | $2,000 | $20,000 |
Use Excel functions like IF and VLOOKUP for complex situations. These functions help automate calculations. This ensures accuracy and saves time.
Using these advanced techniques, you can master the payback period formula in Excel. This helps you make better financial decisions.
Visualizing Payback Period Data
Using Excel to calculate the payback period is powerful. But visualizing the data makes it more meaningful. By creating charts and interpreting graphs, we can see the payback period clearly.
Creating Charts
Charts in Excel help display payback period data. Follow these steps to create effective charts:
- Select your data range.
- Go to the Insert tab.
- Choose a chart type, like Column or Line Chart.
- Click Insert Chart.
Ensure your chart has clear labels and legends. This makes it easier to understand.
Interpreting Graphs
Once you create the chart, the next step is interpreting it. Look for the point where the cumulative cash flow crosses the zero line. This point represents the payback period.
Here are a few tips for interpreting graphs:
- Positive Slope: Indicates increasing returns.
- Flat Line: Suggests a breakeven point.
- Negative Slope: Shows decreasing returns.
Understanding these patterns helps in making better investment decisions.
Common Mistakes To Avoid
Calculating the Payback Period in Excel is a common task. It helps businesses make financial decisions. But, there are common mistakes people often make. Avoiding these errors can save time and ensure accuracy. Let’s look at some common mistakes to avoid.
Data Entry Errors
One of the most common mistakes is data entry errors. Entering wrong numbers can lead to wrong results. Here are some tips to avoid data entry errors:
- Double-check all numbers before entering them.
- Use consistent units for all data entries.
- Create a data validation rule to limit input types.
For example, if you are entering cash flows, make sure they are in the same unit (e.g., thousands or millions). Inconsistent units can make your results inaccurate.
Incorrect Formula Usage
Using the wrong formula in Excel is another common mistake. Ensure you are using the correct formula for the Payback Period. The basic formula is:
=Year + (Initial Investment - Cumulative Cash Flow) / Cash Flow in Next Year
Here are some tips to avoid incorrect formula usage:
- Understand the formula components thoroughly.
- Check Excel’s built-in formula functions.
- Test the formula with known values.
For instance, if you don’t account for cumulative cash flow correctly, your payback period will be wrong. Always verify your formula against manual calculations.
Being cautious with data entries and formula usage ensures accurate payback period calculations in Excel.
Real-world Applications
The Payback Period Formula in Excel is not just theoretical. It has practical uses in the real world. Businesses use it to evaluate the time needed to recover their investments. Let’s delve into some specific applications to understand its importance.
Business Case Studies
Many companies use the payback period to make important decisions. For example, a manufacturing firm considers investing in new machinery. By using the payback period formula in Excel, they can quickly determine how long it will take to recover the cost of the machinery.
Here is a simplified table to illustrate:
| Year | Cash Flow |
|---|---|
| 1 | $20,000 |
| 2 | $25,000 |
| 3 | $30,000 |
| 4 | $35,000 |
In this case, the total investment is $100,000. Using the payback period formula in Excel, the firm can see it takes a bit over three years to recover their investment.
Comparing Investment Options
Businesses often compare multiple investment options. The payback period formula in Excel makes this process straightforward. Consider two projects:
- Project A: Initial investment of $50,000. Annual return of $15,000.
- Project B: Initial investment of $60,000. Annual return of $20,000.
Using the payback period formula, we can calculate:
Project A: $50,000 / $15,000 = 3.33 years

Project B: $60,000 / $20,000 = 3 years
Project B has a shorter payback period. This makes it a more attractive option for quick returns.
In real-world applications, using the payback period formula in Excel can help businesses make informed decisions. It provides clear, quick insights into investment recovery times.
Conclusion And Next Steps
In this section, we’ll summarize the key points about the Payback Period Formula in Excel. We’ll also provide some resources for further learning.
Recap Of Key Points
The Payback Period Formula helps you determine how long it takes to recover an investment. Using Excel for this calculation makes it quick and easy.
- Payback Period is a measure of investment recovery time.
- Excel simplifies the process with built-in functions.
- You can use SUM and IF functions to calculate the payback period.
Further Learning Resources
To deepen your understanding of the Payback Period Formula in Excel, explore the following resources:
- Microsoft Excel’s official documentation
- Online tutorials and courses on platforms like Coursera and Udemy.
- Finance and investment books explaining the Payback Period concept.
Utilize these resources to master the Payback Period Formula and enhance your financial analysis skills.
Credit: m.youtube.com
Frequently Asked Questions
What Is The Payback Period Formula In Excel?
The formula is: `=Initial Investment / Annual Cash Inflow`.
How Do You Calculate Payback Period In Excel?
Use the formula `=A1/B1` where A1 is the initial investment and B1 is the annual cash inflow.
Can Excel Automate Payback Period Calculation?
Yes, Excel can automate it using the formula mentioned and input cells for investment and cash inflow.
What Function Helps With Payback Period In Excel?
Excel doesn’t have a direct function, but you can use basic arithmetic operations.
Is Payback Period Calculation In Excel Accurate?
Yes, it is accurate if you enter the correct initial investment and cash inflow values.
Why Use Excel For Payback Period?
Excel simplifies complex calculations, saves time, and allows easy adjustments to input values.
Conclusion
Mastering the Payback Period formula in Excel is a valuable skill. It helps evaluate investment returns quickly. This method saves time and enhances decision-making. By following the steps outlined, you can efficiently calculate and analyze your investments. Start using Excel today to make informed financial decisions effortlessly.